Data analysis · Completed
Energy & weather insights
I built a Norwegian energy and weather dashboard with Next.js and FastAPI, combining Elhub and Open-Meteo data across five electricity price areas. It includes weather-adjusted demand studies, daily profiles, peaks, anomaly and change analysis, and forecast reliability and feature comparisons. The completed dashboard brings charts, uncertainty, data coverage and reproducible evidence together in a live public application.
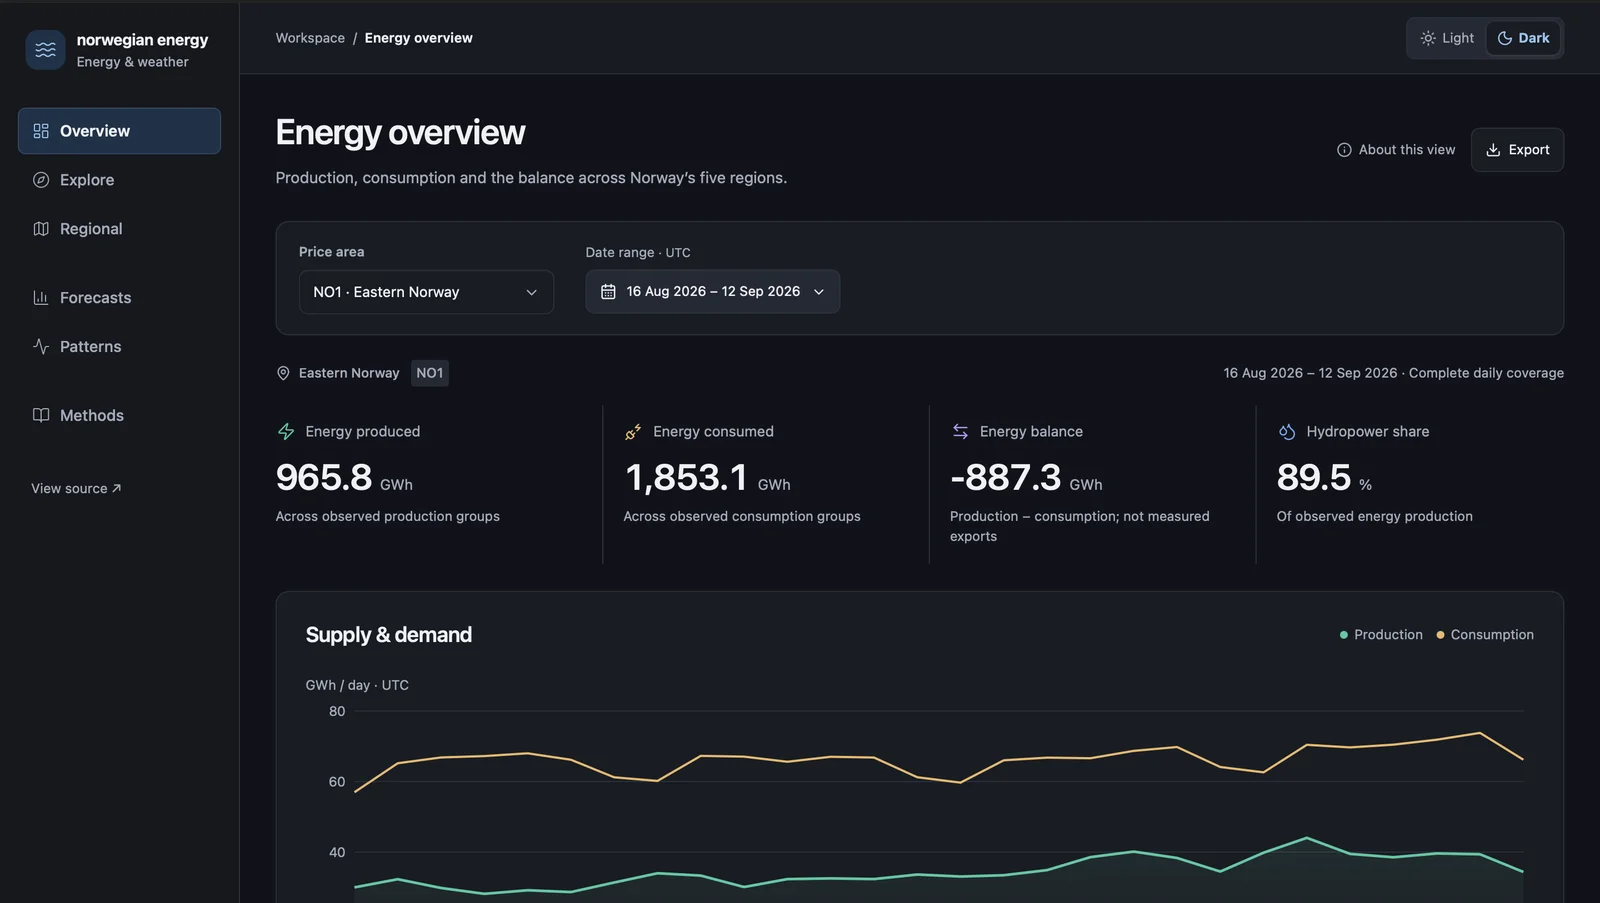
Energy and weather
Explore production, consumption and weather across NO1–NO5, with regional maps, snow drift views, demand peaks and daily profiles for weekdays, weekends and seasons.
Demand studies
Saved studies examine household demand in relation to weather and calendar effects, flag unusual observations and explore persistent changes. Temporal validation, uncertainty and limitations accompany the results; these are retrospective analyses, not live alerts or causal claims.
Forecast evaluation
Compare saved benchmarks, forecast errors and interval coverage across regions and horizons. Feature comparisons assess what calendar, demand history and weather add to prediction, alongside reproducible results and exports.
Interface and evidence
Redesigned the dashboard with light and dark themes, simpler navigation, charts first and expandable methods. Data sources, coverage, freshness, accessible tables and downloads make the evidence inspectable.
Delivery
The completed Next.js and FastAPI application brings statistical analysis and an interactive dashboard together in a live public project.